Logo

Battery Simulator Web - Econo

English 日本語

Energy, Power, and Cost Trade-offs

An interactive tool designed to evaluate the physical design and active-material cost (BOM) relationship in lithium-ion battery cells.

Launch Simulator

Cell Design & Material Cost Relationships

This simulator focuses on the direct relationship between a cell's physical dimensions (electrode thickness, porosity, volume fractions) and its raw material costs. It helps users understand how cell design decisions simultaneously dictate electrochemical performance and economic metrics.
Key Metrics Calculated

  • Bill of Materials (BOM) Cost: Evaluates the raw material purchase cost based on the volume, density, and unit cost ($/kg) of each active and inactive component.
  • Unit Cost per Energy ($/kWh): The cell BOM cost divided by the simulated discharge energy. Shows how thick electrodes decrease unit cost by maximizing active material.
  • Unit Cost per Power ($/kW): The cell BOM cost divided by the 10-second peak power capability. Highlights how high-power designs (thin electrodes) require a higher cost per energy.
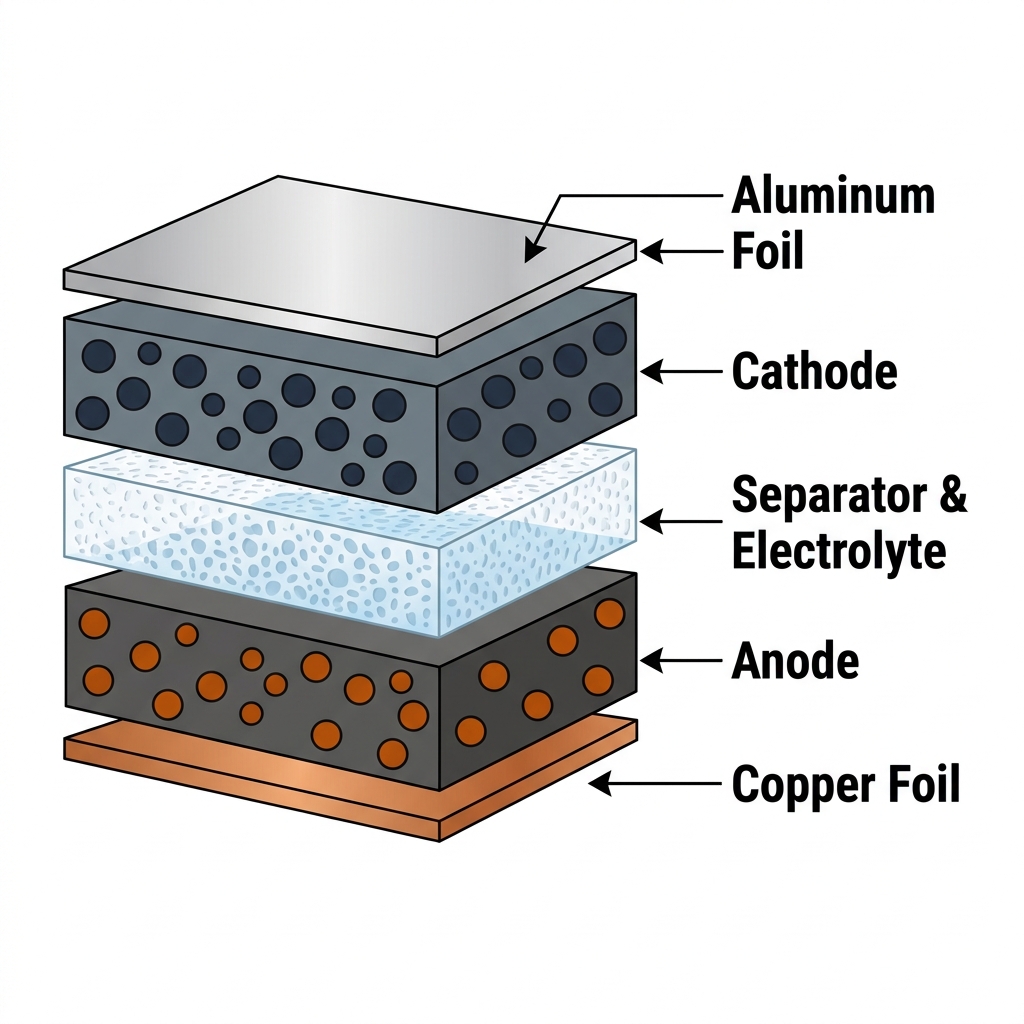
Cell Stack Diagram

Cost Calculation Assumptions

To keep the model clean and educational, the cost calculations rely on the following structural assumptions:

1. Active Stack Only

The BOM calculation only includes the internal components responsible for energy transport and storage: anode/cathode active materials, binders, conductive additives, the separator, the electrolyte, and current collector foils (Copper & Aluminum). It does not account for cell housings (cans, pouches), terminals, external tabs, or pack-level hardware (cooling plates, casing, or BMS). Furthermore, since no overhang margins or electrode overlap tolerances are modeled, the calculations only account for the exact active counter-area (facing area) between the anode and cathode.

2. Raw Material Costs Only

Calculated costs reflect raw materials purchase price only. Manufacturing costs (e.g., slurry mixing, roll coating, calendering, winding, assembly, formation, aging), labor, factory overhead, energy consumption, and yield losses are not modeled.

3. Press Density (Calendering) Model

When you sweep the electrode porosity, the simulator assumes a constant active material mass per unit area. This mirrors a calendering process where pressure is applied to compress the electrode to reduce its thickness. Reducing porosity increases the volumetric packing density but limits liquid-phase ion transport, leading to a rapid power drop-off at high discharge rates.
How to Use the Simulator

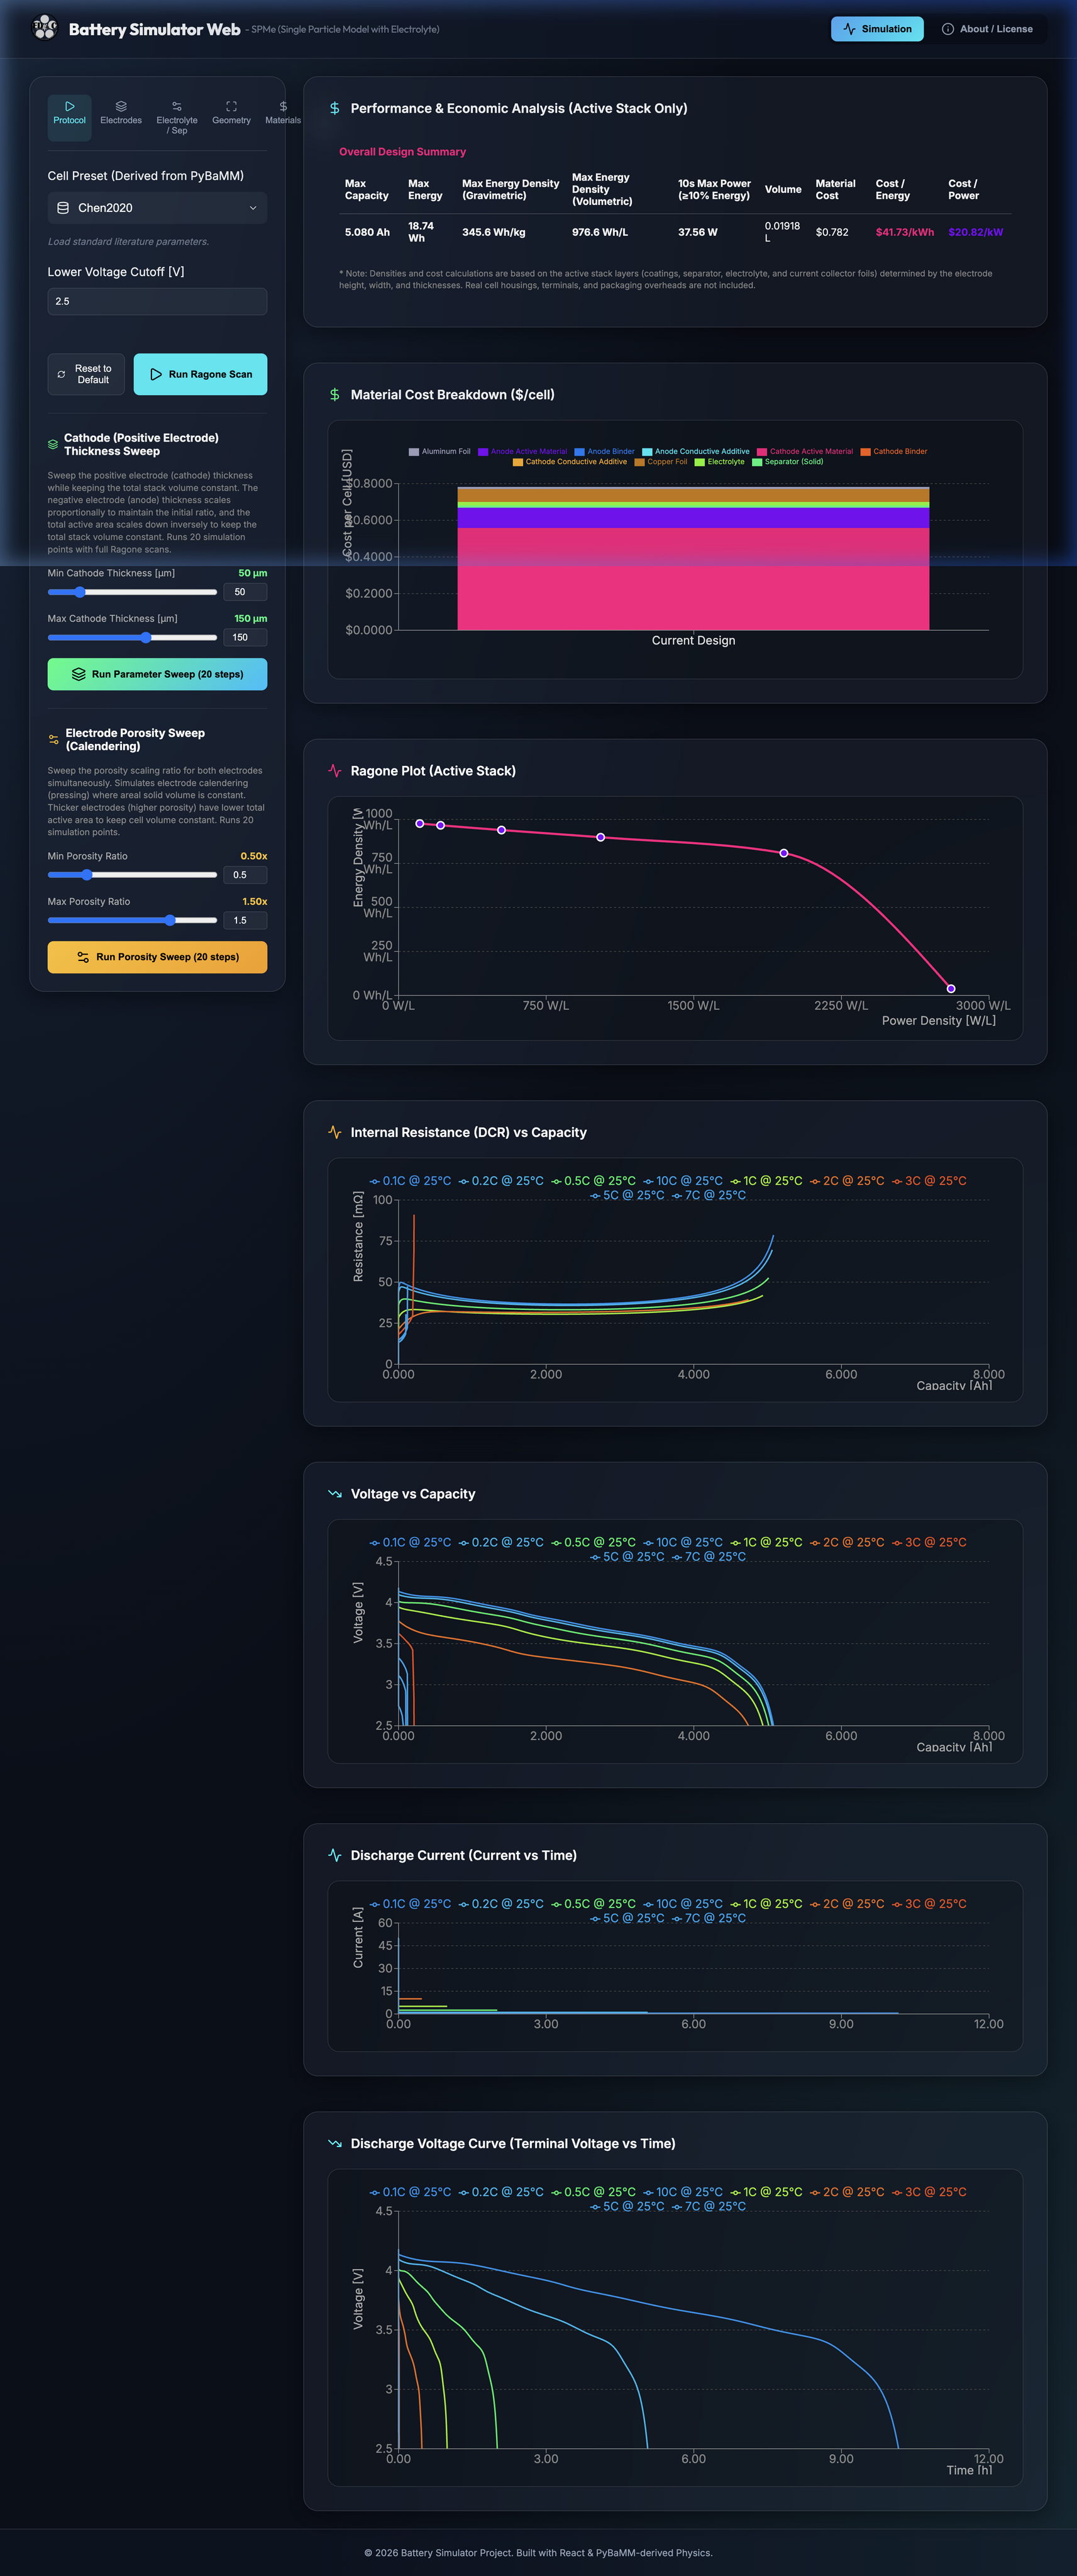
Simulator UI Dashboard

The interface is designed for rapid exploration of electrode designs through parameters sweeps:

Quick Guide

  1. Choose a Preset: Select either Chen2020 (NMC/Graphite) or Prada2013 (LFP/Graphite) to populate baseline physical values and material costs ($/kg).
  2. Analyze the BOM Breakdown: Review the stacked charts displaying which components (like Cathode Active Material or Copper Foil) dominate your cell's cost and weight.
  3. Run a Thickness Sweep: Click "Sweep Thickness" to see how scaling electrode thickness affects the Ragone Plot (Energy vs. Power) and shifts the $/kWh vs. $/kW trade-off curves.
  4. Run a Porosity (Calendering) Sweep: Explore the effects of calendering to find the sweet spot where volumetric energy density is maximized without choking the electrolyte transport.

References & Acknowledgements

The simulator utilizes physical and economic datasets verified in battery literature. We express our gratitude to the PyBaMM (Python Battery Mathematical Modelling) project community for providing the baseline parameter structures.

Academic Literature (Parameter & Cost Baselines)

  • Chen2020: Chen et al. "Development of Experimental Techniques for Parameterization of Multi-scale Lithium-ion Battery Models." J. Electrochem. Soc. 167 (2020): 080534.
  • Prada2013: Prada et al. "A simplified electrochemical and thermal aging model of LiFePO4-graphite Li-ion batteries." J. Electrochem. Soc. 160 (2013): A616.
  • CellEst 3.0 (Material Cost Database): Ruppert et al. "Analyzing material and production costs for lithium-ion and sodium-ion batteries using process-based cost modeling - CellEst 3.0." J. Power Sources Adv. 36 (2025): 100190. https://doi.org/10.1016/j.powera.2025.100190
  • Marquis2019: Marquis et al. "An Upgraded Form of the Single-Particle Model with Electrolyte." J. Electrochem. Soc. 166 (2019): A3693.
  • Landesfeind2019: Landesfeind et al. "Temperature and Concentration Dependence of the Ionic Transport Properties of Lithium-Ion Battery Electrolytes." J. Electrochem. Soc. 166 (2019) A3079.

極板設計とセルコスト・出力の相関関係

本シミュレータは、電極の厚み、空隙率(ポロシティ)、活物質比率といった極板設計パラメータと、セル製造における部材原材料コスト(BOM)の直接的な関係性に焦点を当てています。設計の変更が、電池の電気化学的な性能特性と経済的な指標($/kWh、$/kW)をどのように同時に規定するのかを直感的に学習できます。

算出される主な経済・性能指標

  • 部材材料費(BOMコスト): 各構成部材(活物質、導電助剤、バインダー、セパレータ、電解液、集電金属箔)の体積、密度、材料単価($/kg)から、電池セル内部の原材料費の総和を積算します。
  • 容量あたり単価 ($/kWh): セルBOMコストを、シミュレーションされた放電エネルギーで割った値。電極を厚くして活物質の充填比率を高めるほど、Whあたりの部材単価が下がることがわかります。
  • 出力あたり単価 ($/kW): セルBOMコストを、10秒パルス放電時のピーク出力で割った値。高出力設計(薄膜電極)では、エネルギー容量あたりの単価が上昇するトレードオフを示します。
Cell Stack Diagram

コスト計算における重要な前提と仮定

本シミュレータのコスト予測ロジックには、評価をシンプルかつ学術的な理解に適した形にするため、以下の仮定を設けています。

1. 発電要素(アクティブスタック)のみを考慮

BOMコストの算出対象は、電池内部の発電・イオン移動に関わる主要部材のみです。具体的には、正負極の活物質・バインダー・導電助剤、セパレータ、電解液、集電金属箔(銅箔およびアルミ箔)のみを積算しています。外装缶やラミネートフィルム、電極タブリード、安全弁、モジュール・パック化に必要な筐体、冷却プレート、BMS(電池管理システム)などは含まれません。また、極板重ね合わせのマージン(オーバーハングなどの重なり代)の考慮がないため、正負極の完全な対向面積(対向する活物質塗工領域)部分のみを対象として計算しています。

2. 原材料コストのみの積算(加工費等の除外)

表示されるコストは部材原材料の購入費用のみをモデル化したものです。スラリー調製、コーティング、プレス、スリット、巻回、注液、初期充電・エージングなどの製造組立コスト、労務費、工場償却費、ユーティリティコスト、および歩留まり損失は考慮していません。

3. プレス密度(カレンダー)のシミュレーション

「空隙率(Porosity)スイープ」機能では、電極の面積あたりの活物質塗工量(目付量)を一定に保つよう計算します。これは、ロールプレス機により極板を物理的に圧縮して空隙を潰し、厚みを減少させるプロセスを模擬しています。プレスを進めて空隙率を下げるほど体積エネルギー密度は向上しますが、電解液のイオン移動が阻害されるため、高Cレート放電時の出力低下が顕著になります。

シミュレータの使い方

Simulator UI Dashboard

操作パネルは、極板設計の変更によるトレードオフ変化を迅速にスイープ(水準変更)検証できるように配置されています。

クイックガイド

  1. プリセットの選択: Chen2020(NMC/グラファイト)または Prada2013(LFP/グラファイト)を選択し、各材料の密度や単価($/kg)の文献値を読み込みます。
  2. BOM内訳の確認: どの材料(正極活物質や集電体箔など)がセルのコストや重量の何割を占めているかを、ダッシュボード上の積層グラフで確認します。
  3. 厚みスウィープの実行: 「Sweep Thickness」を実行し、電極を厚くした際にエネルギー密度が向上する一方で、いかに入出力特性(ラゴンプロット)が低下し、$/kWhと$/kWの関係がシフトするかを可視化します。
  4. 空隙率スウィープの実行: カレンダープレス圧による変化を想定したスイープを行い、高レート放電で電解液拡散限界が起きて急激に性能低下する手前の「最適なプレス密度」を探索します。

Reference & Acknowledgements (引用と謝辞)

本シミュレータは、電池モデリングの世界的なオープンソースフレームワークである PyBaMM (Python Battery Mathematical Modelling) プロジェクトコミュニティが公開している物理パラメータセットの構造に深く感謝し、それらの文献データをベースに構築されています。

学術論文(パラメータおよび材料コストの参照元)

  • Chen2020: Chen et al. "Development of Experimental Techniques for Parameterization of Multi-scale Lithium-ion Battery Models." J. Electrochem. Soc. 167 (2020): 080534.
  • Prada2013: Prada et al. "A simplified electrochemical and thermal aging model of LiFePO4-graphite Li-ion batteries." J. Electrochem. Soc. 160 (2013): A616.
  • CellEst 3.0 (材料コストデータベース): Ruppert et al. "Analyzing material and production costs for lithium-ion and sodium-ion batteries using process-based cost modeling - CellEst 3.0." J. Power Sources Adv. 36 (2025): 100190. https://doi.org/10.1016/j.powera.2025.100190
  • Marquis2019: Marquis et al. "An Upgraded Form of the Single-Particle Model with Electrolyte." J. Electrochem. Soc. 166 (2019): A3693.
  • Landesfeind2019: Landesfeind et al. "Temperature and Concentration Dependence of the Ionic Transport Properties of Lithium-Ion Battery Electrolytes." J. Electrochem. Soc. 166 (2019) A3079.

Cite This Simulator (BibTeX)

@misc{kusachi2025econo,
  author = {Yuki Kusachi},
  title = {Battery Simulator Web - Energy, Power, and Cost Trade-offs (Econo)},
  year = {2025},
  url = {https://www.edandc.com/BattSimWeb-Econo/},
  note = {YK Energy Device \& Consulting}
}