- Non-Destructive Tracking of Electrode Phase Transitions: By converting subtle charge/discharge voltage plateaus into sharp differential peaks, Differential Capacity Analysis ($dQ/dV$ or ICA: Incremental Capacity Analysis) provides an indispensable, non-destructive technique to isolate and quantify Loss of Lithium Inventory (LLI) from Loss of Active Material at positive and negative electrodes ($\text{LAM}_{\text{PE}}, \text{LAM}_{\text{NE}}$) without cell teardown.
- Experimental Realities and Noise Traps: 12- to 16-bit ADC quantization noise, fixed time-interval sampling, and thermal oscillations from environmental chambers via the entropic coefficient ($dE/dT$) readily generate periodic artificial peaks (phantom peaks). Over-reliance on aggressive smoothing filters risks inducing artificial peak potential shifts of $10\sim 20\,\text{mV}$.
- Full-Cell Signal Convolution and Diagnostic Misinterpretations: Because terminal voltage reflects the difference between cathode and anode potentials ($V = U_p - U_n - \eta$ during discharge, with $\eta > 0$), peak overlaps and Ohmic Resistance Increase (ORI) are frequently misdiagnosed as true lithium inventory loss (LLI).
- Through-Thickness Reaction Heterogeneity (The DFN Reality): In contrast to the idealized Single Particle Model (SPM), practical porous electrodes exhibit a significant phase lag in lithiation between the separator side and the current collector side. The resulting peak broadening must not be mistaken for structural material degradation (LAM).
- Coupling with Physics-Based Simulators (BattSimWeb): Combining multi-rate charge/discharge measurements with electrochemical physics models enables researchers to objectively decouple thermodynamic phase equilibria (OCV origins) from kinetic overpotentials (transport limitations and interfacial resistances).
1. Introduction: Why $dQ/dV$ Matters Today in Battery Development
During cycle-life testing and durability evaluations of lithium-ion batteries, cyclers generate vast volumes of voltage-capacity ($V-Q$) curves. However, merely inspecting terminal voltage curves yields only macroscopic capacity and power fade information—such as "retained capacity dropped to 85%" or "overall discharge voltage degraded."
Crucial mechanistic details inside the cell—such as "how many milliampere-hours of cyclable lithium have been trapped in passivating surface films (LLI: Loss of Lithium Inventory)" or "how much active material in the cathode vs. anode has suffered structural degradation or electrical isolation (LAM: Loss of Active Material)"—remain completely hidden within a black box.
While once confined to academic laboratories, this analytical framework has become critically decisive in today's (2020s) industrial landscape, driven by the global adoption of electric vehicles (EVs) and massive utility-scale Battery Energy Storage Systems (BESS). Whether executing in-line State-of-Health (SOH) tracking on embedded automotive BMS platforms, 100% early screening of manufacturing defects during cell formation, or rapid health grading of retired EV packs for second-life repurposing, the ability to rapidly identify internal degradation modes strictly from external terminal data without destructive teardown now defines industrial competitiveness.
Traditionally, directly determining this breakdown required "destructive physical analysis" (post-mortem examination): transferring an aged cell into an argon-filled glovebox, dismantling it, harvesting and rinsing electrode samples, and reassembling half-cells against lithium metal foil for coin-cell testing. Beyond being extremely labor-intensive, this approach inherently risks active material delamination during harvesting and irreversible oxidation or moisture contamination of delithiated cathodes and lithiated anodes during sample handling.
As a powerful non-destructive alternative, Differential Capacity Analysis (DCA, $dQ/dV$, or Incremental Capacity Analysis: ICA) has emerged as the global industry benchmark for tracking positive and negative electrode dynamics strictly from cycling data.
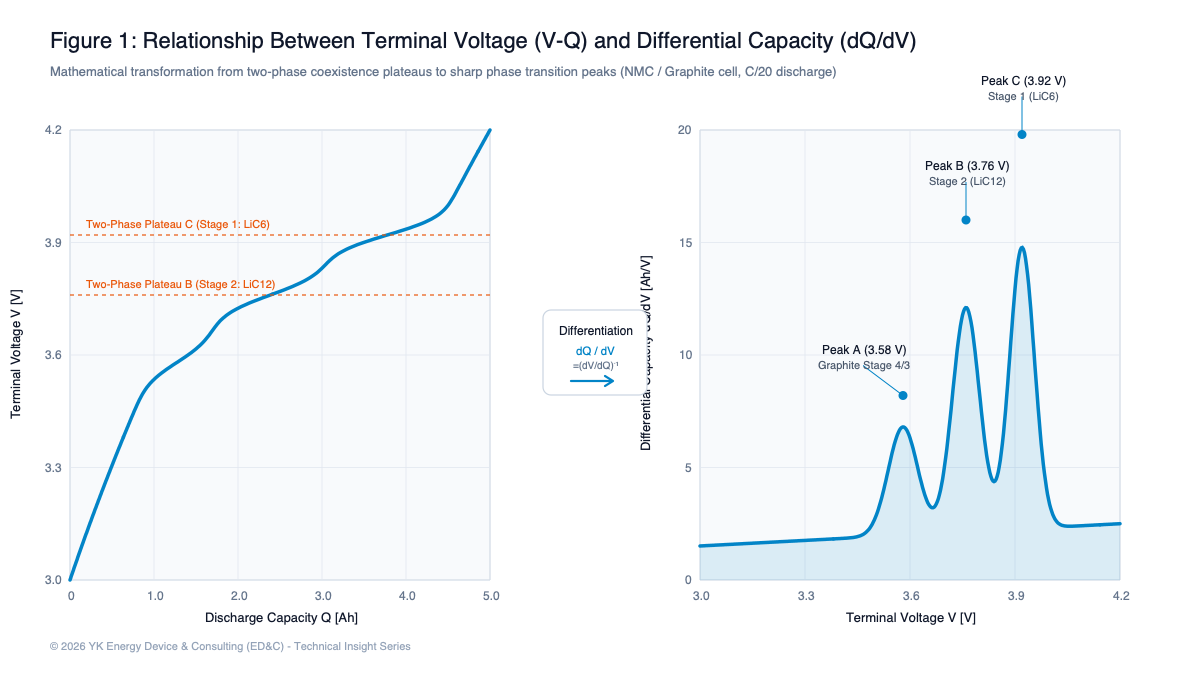
The operating principle is elegant and rooted in thermodynamics. When an active material undergoes a crystallographic phase transition, the chemical potential of lithium remains constant across the two-phase coexistence region (thermodynamic equilibrium plateau), causing the open-circuit voltage (OCV) to remain nearly flat as capacity progresses. Calculating the derivative of capacity with respect to voltage, $\frac{dQ}{dV} = \left(\frac{dV}{dQ}\right)^{-1}$, yields a vanishingly small denominator ($dV \approx 0$), causing $dQ/dV$ to surge sharply and form a prominent peak.
The potential (horizontal axis) at which this peak appears reflects the thermodynamic phase-transition potential of the active material, while the integrated peak area (vertical spread) corresponds directly to the electrical charge transferred during that phase transformation (phase capacity width). Consequently, $dQ/dV$ operates like a non-destructive electrochemical spectrometer, tracking the independent degradation of cathode and anode (bearing in mind that full cells yield a convoluted signal of both electrodes).
While this article primarily focuses on automotive-grade nickel-manganese-cobalt (NMC) / graphite cells, lithium iron phosphate (LFP) cathodes exhibit an exceptionally rigid two-phase reaction ($\text{FePO}_4 / \text{LiFePO}_4$) yielding an ultra-flat voltage plateau (with voltage variations within a few millivolts around $3.4\,\text{V}$), producing a massive, singular $dQ/dV$ peak. Because determining State of Charge (SOC) in LFP cells directly from $V-Q$ curves is notoriously difficult, phase-boundary tracking via $dQ/dV$ and $dV/dQ$ proves indispensable.
2. Experimental Realities: Measurement Conditions and Pitfalls in dQ/dV Accuracy
In academic publications, $dQ/dV$ profiles are typically depicted as clean, smooth curves from which degradation modes are straightforwardly extracted. In real-world battery labs, however, every engineer quickly discovers how unforgiving numerical differentiation can be. Applying naive finite differences to raw cycling data amplifies minute instrumentation noise into violent spikes, completely obscuring genuine phase-transition features.
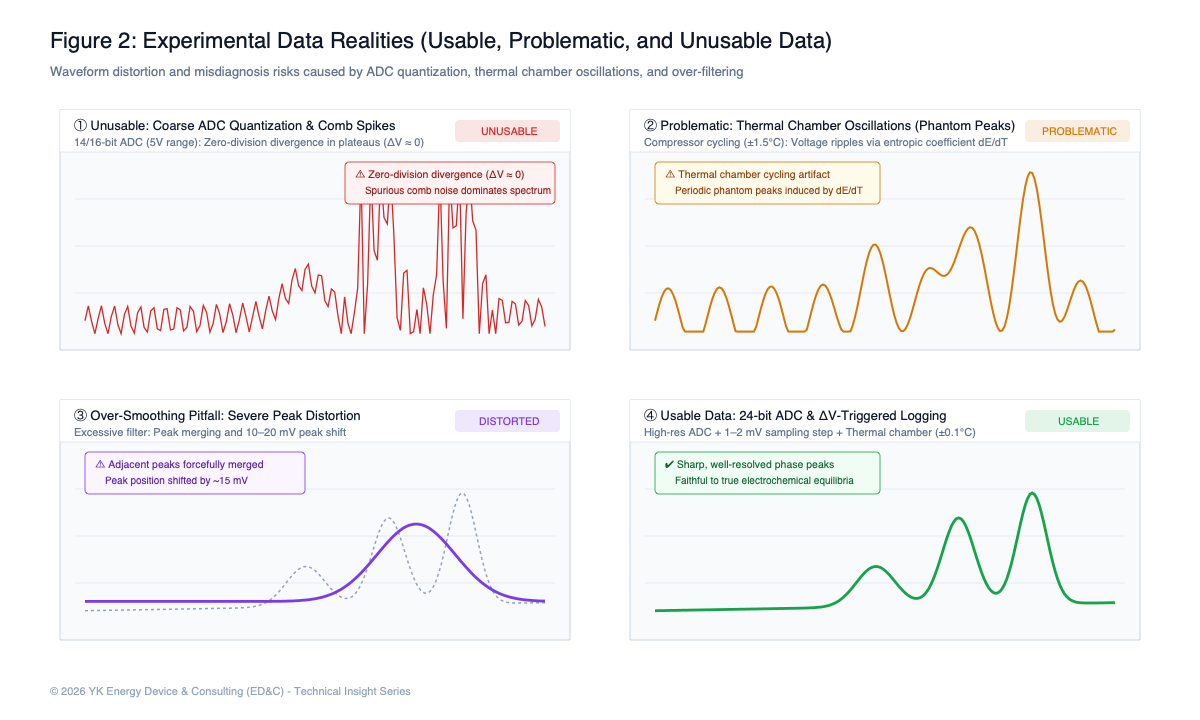
Experimental cycling data in practice falls into three distinct quality tiers depending on hardware specifications and chamber control:
| Data Quality Tier | Typical Hardware & Test Setup | Physical Noise Mechanisms | Practical Analytical Utility |
|---|---|---|---|
| Troublesome / Requires Preprocessing |
• 12-bit to 16-bit general-purpose data loggers • Fixed time-interval sampling (e.g., every 10 s) • Chamber temperature oscillations ($\pm 1\sim 2^\circ\text{C}$) |
• $\Delta V \approx 0$ along plateaus causes derivative divergence (dense comb-like spikes) • Data points become excessively sparse in phase-transition zones • Chamber compressor cycles superimpose millivolt-level ripples creating "phantom peaks" |
Unusable without Heavy Preprocessing Raw finite differentiation fails entirely. Requires voltage binning or regularized smoothing splines before analysis. |
| Moderate / Use with Caution |
• High-rate cyclers with switching power supply ripple • Overly aggressive Savitzky-Golay or moving average filters • Ignoring charge/discharge hysteresis |
• Current ripple in $dQ = I(t)dt$ induces high-frequency voltage noise • Excessive filtering shifts peak apexes by $10\sim 20\,\text{mV}$ and merges adjacent peaks • Charge and discharge peaks diverge due to kinetic overpotential and thermodynamic hysteresis |
Suitable for Qualitative Trend Tracking Absolute peak metrics contain non-negligible error. Best reserved for relative cycle-aging trends or paired with physics-model fitting. |
| High-Quality Research Grade |
• 24-bit $\Delta\Sigma$ high-resolution ADC instruments • $\Delta V$-triggered sampling (every $1\sim 2\,\text{mV}$) • Quasi-equilibrium rates (C/20 to C/50) & precision Peltier chambers ($\pm 0.1^\circ\text{C}$) |
• Evenly spaced, dense data points ($1\sim 2\,\text{mV}$) maintained across voltage plateaus • Thermal EMF drift is negligible ($< 0.05\,\text{mV}$) • Light, low-order filtering cleanly reveals sharp, true phase transitions |
Enables High-Precision Quantitative Diagnosis Enables full deconvolution of LLI, $\text{LAM}_{\text{PE}}$, and $\text{LAM}_{\text{NE}}$. Directly connects to physical model parameter identification. |
Three Hidden Pitfalls in Experimental Measurement
① Sampling Strategy: Fixed Time-Interval ($\Delta t$) vs. Fixed Voltage-Step ($\Delta V$)
Most commercial battery cyclers default to fixed time-interval logging (e.g., logging every 10 or 30 seconds). However, across a two-phase coexistence plateau at C/20 discharge, the battery voltage may vary by only a few millivolts over 30 minutes or more (and over an hour in LFP cells). Consequently, only a handful of data points are recorded in the plateau region where dense phase-transition data is most critical. When minor instrumentation noise results in $\Delta V = V_k - V_{k-1}$ approaching zero, the derivative $\frac{\Delta Q}{\Delta V}$ skyrockets, generating massive artificial spikes.
Conversely, near the end of discharge where voltage plunges steeply, data points are recorded in excessive density. For reliable $dQ/dV$ analysis, setting cyclers to "record a point whenever voltage changes by $1\sim 2\,\text{mV}$ ($\Delta V$ triggering)" is paramount. At $1\sim 2\,\text{mV}$ intervals, a typical phase-transition peak with a full width at half maximum (FWHM) of $20\sim 50\,\text{mV}$ is captured by $10\sim 25$ well-distributed points, faithfully reconstructing the true peak geometry. If only time-logged data is available, applying a "Voltage Binning" algorithm—integrating capacity within uniform voltage bins during post-processing—is an industry best practice.
② "Phantom Peaks" Driven by Environmental Chamber Cycles
Ambient temperature stability is another critical blind spot. A lithium-ion battery's open-circuit voltage (OCV) incorporates an entropic temperature coefficient $\frac{dE}{dT}$, which varies between $-1.0$ and $+0.3\,\text{mV/K}$ depending on the lithiation stage and active material crystal phase (Reynier et al., 2004).
In low-cost or large environmental chambers operating under bang-bang (ON-OFF) compressor control, the internal temperature oscillates with an amplitude of $\Delta T \approx \pm 1^\circ\text{C}$. This temperature cycling superimposes a periodic thermoelectric voltage ripple onto the terminal voltage:
During ultra-low-rate testing (such as C/20), this slow thermal wave (tens of minutes per cycle) rides on the charge/discharge profile. Upon numerical differentiation, it generates a train of artificial peaks spaced at regular voltage intervals ("Phantom Peaks"). Unwary researchers often mistake these environmental artifacts for newly discovered, subtle phase transitions. Robust analysis demands precision Peltier-controlled chambers ($\pm 0.1^\circ\text{C}$) or synchronized surface temperature logging for thermoelectric compensation.
③ Loss of Peak Integrity from Over-Smoothing
Faced with noisy raw data, engineers often resort to widening the window of Savitzky-Golay filters or applying heavy moving-average/Gaussian smoothing. While this produces visually pleasing curves, excessive smoothing irreversibly merges closely spaced phase-transition peaks into an amorphous hump and shifts the peak apex by $10\sim 20\,\text{mV}$.
Practical Takeaway
Before attempting to rescue corrupted waveforms with filtering algorithms, engineers must prioritize the physical integrity of the measurement chain: 24-bit ADC resolution, $\Delta V$-triggered sampling, and $\pm 0.1^\circ\text{C}$ chamber stability are essential prerequisites for trustworthy $dQ/dV$ diagnostics.
3. Capabilities and Blind Spots: Isolating Degradation Modes and Avoiding Diagnostic Traps
What $dQ/dV$ Can Reveal: Isolating Primary Degradation Modes (LLI, LAM_PE, LAM_NE, ORI)
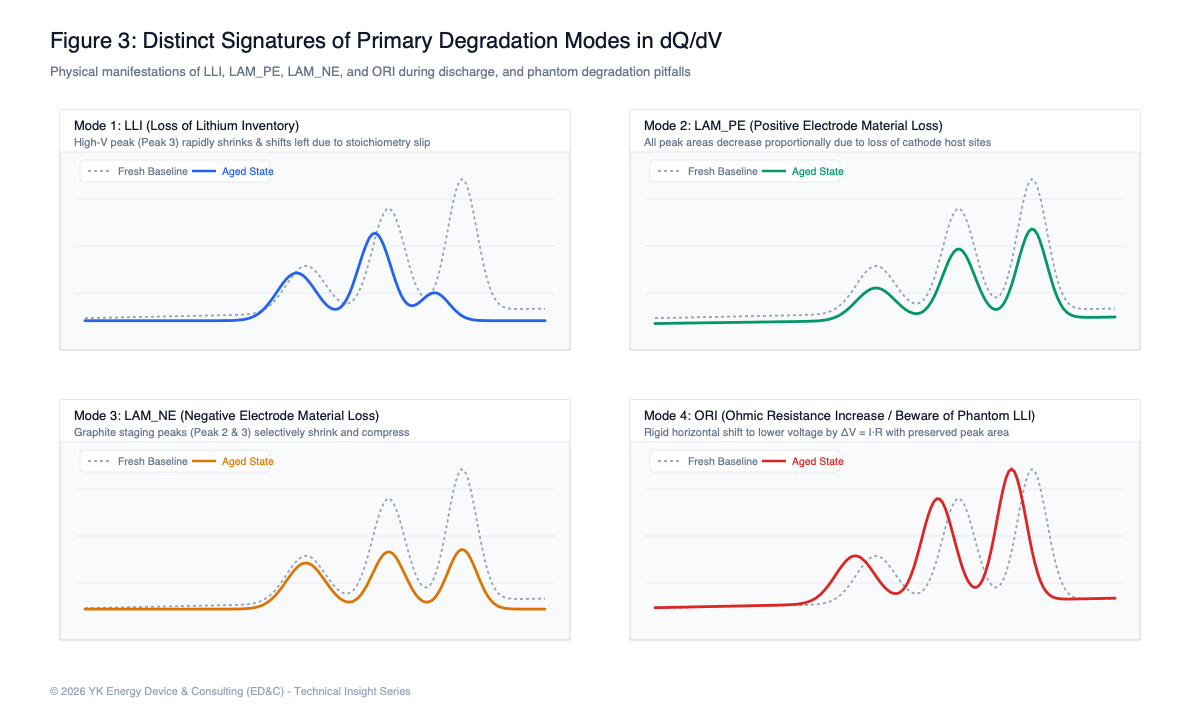
When backed by pristine measurement data, tracking shifts in peak potentials (horizontal axis) and peak areas (vertical axis) allows clear discrimination among the primary battery degradation modes (Birkl et al., 2017):
- Loss of Lithium Inventory (LLI): Driven by continuous SEI growth or lithium plating at the anode, cyclable lithium ions are consumed and irreversibly trapped. This induces a relative slippage between the positive and negative electrode operating stoichiometry windows ($x$ and $y$), shifting the potential separation between specific full-cell peaks.
- Loss of Active Material at Positive Electrode ($\text{LAM}_{\text{PE}}$): Particle microcracking, crystallographic phase degradation, transition-metal dissolution (and subsequent migration to the anode, compromising the SEI), and detachment from the conductive network reduce the active cathode volume, shrinking the area of cathode-specific phase-transition peaks.
- Loss of Active Material at Negative Electrode ($\text{LAM}_{\text{NE}}$): Graphite exfoliation and electrical disconnection reduce active anode capacity, shrinking graphite staging peak areas.
- Ohmic Resistance Increase (ORI): Current collector corrosion, electrolyte dry-out, and interfacial contact degradation generate an Ohmic overpotential $\eta = I R_{\Omega}$, translating the entire $dQ/dV$ profile along the voltage axis depending on current polarity.
What $dQ/dV$ Cannot Reveal: Three Critical Diagnostic Traps
Despite its analytical power, three physical constraints can easily lead engineers into costly misdiagnoses if unaddressed:
Trap 1: The Full-Cell Convolution Dilemma (Peak Overlap)
The terminal voltage $V(t)$ of a two-terminal full cell is the cathode potential $U_p(y)$ minus the anode potential $U_n(x)$, minus the total overpotential $\eta$ ($V(t) = U_p(y) - U_n(x) - \eta$ during discharge, where $\eta > 0$):
The observed full-cell $dQ/dV$ spectrum is a non-linear composite of positive and negative electrode transitions. For instance, in an NMC/graphite cell around $3.8\sim 3.9\,\text{V}$, an NMC phase transition ($U_p \approx 3.95\sim 4.00\,\text{V vs Li/Li}^+$) closely coincides with graphite Stage 2 deintercalation ($U_n \approx 0.08\sim 0.12\,\text{V vs Li/Li}^+$). If peak area diminishes in this region, mathematical deconvolution into pure $\text{LAM}_{\text{PE}}$ versus $\text{LAM}_{\text{NE}}$ is fundamentally impossible from single-cell cycling data alone. Resolving this ambiguity requires curve fitting against half-cell reference libraries or electrochemical physics simulations.
Trap 2: Phantom LLI (Confusing Resistance Rise with Lithium Loss)
As illustrated in Figure 3(d), cell aging that increases internal resistance (ORI) lowers the entire discharge curve by the Ohmic drop $\eta = IR$. Consequently, discharge $dQ/dV$ peaks shift uniformly toward lower voltages.
This downward shift in discharge peaks closely mimics the stoichiometric slip produced by lithium inventory loss (LLI), frequently leading engineers to falsely conclude that severe lithium consumption has occurred.
The definitive diagnostic solution is to compare charge and discharge $dQ/dV$ peak shifts at the exact same C-rate. In an aged cell where thermodynamic slip (LLI) and Ohmic resistance ($IR$) occur simultaneously, the charge peak shift $\Delta V_{\text{charge}}$ and discharge peak shift $\Delta V_{\text{discharge}}$ follow:
Taking the sum and difference yields an exact mathematical decoupling:
This decoupling isolates the true thermodynamic potential slip (LLI) from kinetic Ohmic overpotential (ORI).
Trap 3: Kinetic Concentration Gradients vs. Irreversible Capacity Fade
Starting a low-rate $dQ/dV$ measurement immediately after fast cycling without adequate rest leaves persistent solid-state and liquid-phase concentration gradients within active particles and electrolyte pores.
Under this non-equilibrium condition, peak separations narrow transiently, mimicking LLI. Cells must be allowed a sufficient thermal rest period (several hours) until the relaxation rate approaches equilibrium ($dV/dt \approx 0$) before acquiring diagnostic curves.
4. Through-Thickness Reaction Heterogeneity & $dQ/dV$ Profiles (Beyond Single-Particle Models)
Many conventional battery analysis tools interpret $dQ/dV$ under the Single Particle Model (SPM) assumption, which represents each electrode as a single representative spherical particle. SPM assumes that every active particle experiences an identical overpotential and undergoes phase transitions in perfect synchrony.
In modern commercial high-energy-density cells, however, single-sided electrode coating thicknesses reach $60\sim 80\,\mu\text{m}$ for cathodes and $70\sim 100\,\mu\text{m}$ for anodes, compacted to high calendered densities (approx. $3.2\sim 3.5\,\text{g/cm}^3$ for cathodes and $1.5\sim 1.7\,\text{g/cm}^3$ for anodes). In such thick electrodes, through-thickness reaction heterogeneity becomes dominant and cannot be explained by single-particle approximations.
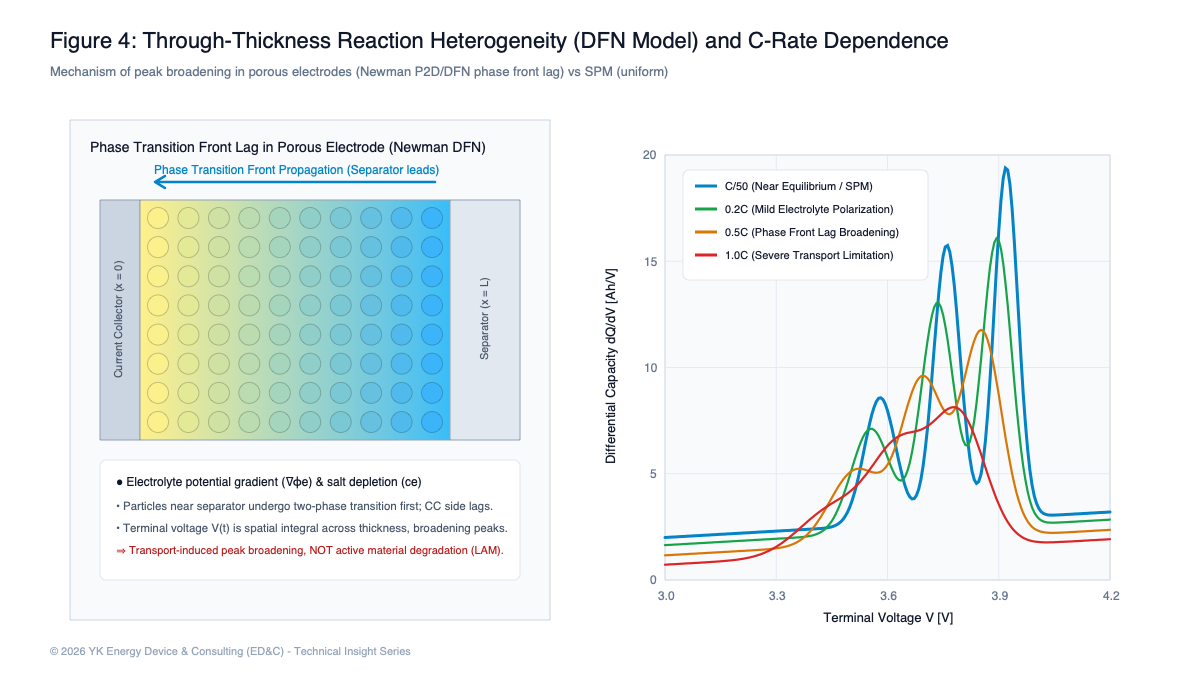
During discharge, lithium ions migrate from the separator through the electrolyte into the depth of the porous electrode. Because the liquid electrolyte exhibits finite ionic conductivity $\kappa$ and diffusion coefficient $D_e$, a liquid-phase potential drop $\nabla \phi_e$ and salt concentration gradient $\nabla c_e$ inevitably develop. Consequently, active particles closest to the separator experience the highest interfacial overpotential and cross the phase-transition plateau earlier than particles near the current collector, which lag behind due to the liquid-phase resistance.
The total current measured across cell terminals represents the spatial integral $\int_0^L j(x, t) dx$ of volumetric interfacial reaction current density $j(x, t)$ across the electrode thickness $x \in [0, L]$ (where $L$ is coating thickness). Because countless particles transition out of phase with one another across the thickness, the $dQ/dV$ peak observed at the terminals is fundamentally broader and lower in peak height than the intrinsic thermodynamic peak of an isolated particle.
Failing to recognize this physical mechanism frequently leads engineers to mistakenly assume that post-cycling peak broadening indicates active material crystal degradation (LAM). In reality, it may simply reflect increased tortuosity, pore clogging, or electrolyte depletion that exacerbates through-thickness reaction heterogeneity.
5. Multi-Rate $dQ/dV$ Simulations and Physics-Based Disentanglement (BattSimWeb Integration)
Experimental $dQ/dV$ curves inherently merge thermodynamic equilibrium potentials (OCV) with kinetic overpotentials (Ohmic drop, charge-transfer resistance, and mass transport). Decoupling these contributions requires combining quasi-equilibrium data (e.g., C/20) with dynamic cycling at varying rates (0.5C, 1C, 2C) alongside physics-based electrochemical simulations.
ED&C's suite of web-based electrochemical simulators (BattSimWeb-SPMe and BattSimWeb-DFN) automatically compute $dQ/dV$ concurrently with terminal voltage across every time step, visualizing rate-dependent peak transformations in real time. For low-to-moderate rates, the Extended Single Particle Model (SPMe) provides rapid execution with electrolyte polarization corrections, while the full Doyle-Fuller-Newman (DFN / P2D) model captures salt depletion and spatial reaction non-uniformity across thick electrodes under high-rate demands.
Deformation Mechanisms of $dQ/dV$ across C-Rate Regimes
- Ultra-Low Rates (C/20 to C/10: Thermodynamic Equilibrium Regime): Overpotentials $\eta \approx 0$. Peak positions align closely with thermodynamic OCV phase transitions, and peak areas accurately quantify phase capacity widths. Differences between charge and discharge peaks are confined strictly to thermodynamic structural hysteresis ($\Delta V_{\text{hyst}} \approx 10\sim 30\,\text{mV}$).
- Moderate Rates (0.5C to 1C: Ohmic & Charge-Transfer Controlled Regime): Ohmic resistance and Butler-Volmer kinetics drive a distinct split: charge peaks shift to higher potentials while discharge peaks shift downward. Non-linear polarization under larger currents introduces asymmetric peak distortion, though total peak area is largely conserved if solid diffusion remains sufficient.
- High Rates (2C+: Mass-Transport & Concentration Polarization Regime): Severe electrolyte salt depletion in electrode pores and steep intra-particle solid diffusion gradients severely flatten and suppress peaks. Furthermore, premature collision with cutoff voltages leads to starkly asymmetric peak clipping between charge and discharge.
Charge vs. Discharge $dQ/dV$: Fundamental Profile Asymmetries Under Elevated C-Rates
A question frequently debated in engineering practice is: "Should we use charge-derived or discharge-derived $dQ/dV$, and how do they fundamentally differ?" As C-rate increases, charge and discharge profiles diverge across three intrinsic physical dimensions:
1. Overpotential Polarity Inversion and Peak Separation (Decoupling Hysteresis from Polarization)
Terminal voltage equations reflect opposite overpotential signs $\eta(I, t) > 0$ between charge and discharge:
$$V_{\text{charge}}(t) = U_p(y) - U_n(x) + \eta_{\text{ch}}, \quad V_{\text{discharge}}(t) = U_p(y) - U_n(x) - \eta_{\text{dis}}$$As the C-rate scales from 0.05C to 0.5C, 1C, and 2C, charge $dQ/dV$ peaks shift monotonically upward, while discharge peaks shift downward. The potential gap $\Delta V_{\text{ch-dis}}$ between corresponding peaks widens rapidly:
$$\Delta V_{\text{ch-dis}} = V_{\text{ch}}^{\text{peak}} - V_{\text{dis}}^{\text{peak}} \approx \Delta V_{\text{hyst}} + \left(\eta_{\text{ch}} + \eta_{\text{dis}}\right)$$The residual separation at the zero-current limit ($I \to 0$), $\Delta V_{\text{hyst}}$, represents intrinsic thermodynamic OCV hysteresis, whereas the rate-dependent divergence captures kinetic polarization. Plotting both simultaneously provides a complete separation of thermodynamics from transport kinetics.
2. Asymmetric Peak Truncation from Premature Cutoff Voltage Collisions
When elevated C-rates magnify overpotential $\eta$, terminal voltage strikes operating limits prematurely, causing opposite peaks to be clipped from the active measurement window:
- High-Rate Charging (Clipping of High-Potential Peaks): During charging, overpotential pushes voltage upward, hitting the upper cutoff (e.g., 4.2V) prematurely. Consequently, end-of-charge transitions occurring at high SOC—such as graphite Stage 1 ($\text{LiC}_6$) formation and high-potential cathode transitions—are pushed out of the constant-current (CC) window into the constant-voltage (CV) taper. Differentiating CC data leaves these high-potential peaks truncated or invisible.
- High-Rate Discharging (Clipping of Low-Potential Peaks): During discharge, overpotential pulls voltage downward, striking the lower cutoff (e.g., 2.5V to 2.8V) early. As a result, low-SOC transitions—such as deep cathode lithiation and the final graphite deintercalation stage—are truncated below the cutoff threshold.
3. Directional Asymmetry in Reaction Kinetics and Electrolyte Transport
Charging is not simply the time-reversal of discharge. Solid-state diffusion coefficients $D_s(c_s)$ vary by orders of magnitude with lithium concentration $c_s$, and activation energies for phase-boundary movement (intercalation vs. deintercalation) differ.
Furthermore, in the porous electrolyte phase, charging transports lithium ions from cathode to anode, concentrating salt near the separator/anode interface while depleting it near the cathode current collector. During discharge, this gradient completely reverses. This directional inversion of salt profiles across the electrode thickness produces asymmetric peak suppression and broadening even at identical 1C current magnitudes.
💡 Crucial Insight for BMS & Fleet Degradation Diagnostics
In commercial EV operation, discharge profiles fluctuate erratically due to dynamic acceleration and regenerative braking, making clean discharge $dQ/dV$ extraction nearly impossible. Consequently, automotive BMS and fleet analytics rely almost exclusively on constant-current (CC) charging $dQ/dV$ obtained during depot or overnight grid charging.
However, analyzing charge $dQ/dV$ in isolation carries a major trap: both kinetic resistance growth ($\eta = IR$) and thermodynamic lithium inventory loss (LLI) shift peaks in the exact same upward direction, creating high risk of misdiagnosis.
For scheduled maintenance, laboratory benchmarking, or digital twin validation in BattSimWeb, performing paired charge/discharge $dQ/dV$ analysis at identical C-rates is strongly recommended. Tracking the midpoint trajectory $\frac{V_{\text{ch}} + V_{\text{dis}}}{2}$ eliminates overpotential to isolate pure thermodynamic LLI, while the difference $V_{\text{ch}} - V_{\text{dis}}$ provides an unequivocal measure of transport resistance and kinetic degradation.
In practical workflows, engineers overlay measured multi-rate curves (e.g., 0.2C, 0.5C, 1C, 2C) with simulated $dQ/dV$ profiles generated by BattSimWeb using parameterized physical properties (particle radius $R_p$, ionic conductivity $\kappa$, diffusion coefficient $D_s$, coating thicknesses $L_p, L_n$).
If C/20 peak areas match simulation while 1C peaks exhibit severe broadening and potential shifts, the engineer can confidently conclude that the cell has not suffered active material loss ($\text{LAM}$), but rather that electrolyte degradation (ORI) or transport limitations dominate.
🚀 Experience dQ/dV Simulation with ED&C Web Simulators:
6. Expanding Industrial Applications: From BMS to Second-Life Grading
Differential capacity analysis has advanced far beyond academic material characterization, becoming a core technology deployed across the entire battery life cycle:
① Online SOH Tracking in Automotive and Stationary BMS
In electric vehicles, full discharges from $100\%$ down to $0\%$ are exceedingly rare; operation is centered around partial cycling between $30\%$ and $80\%$ SOC.
Under these conditions, standard Coulomb counting accumulates persistent drift. In contrast, low-rate constant-current (CC) charging during residential Level-2 or overnight grid charging provides quiet, highly reproducible data windows.
Given embedded MCU resource constraints, onboard systems deploy localized spline filters targeting narrow SOC windows (e.g., $20\%\sim 50\%$ SOC) or stream compressed segments via telematics to cloud digital twins for feature engineering. This enables continuous tracking of SOH along with precise LLI and LAM attribution throughout vehicle life.
② Complementary Hybrid Diagnostics with DVA ($dV/dQ$)
A natural companion to $dQ/dV$ is Differential Voltage Analysis (DVA, $dV/dQ$). While mathematically reciprocal, they exhibit heightened sensitivity in complementary electrochemical regimes:
| Method | Mathematical Definition | Peak Sensitivity Regime | Primary Practical Applications |
|---|---|---|---|
| dQ/dV (ICA) Differential Capacity |
dQ / dV | Voltage Plateaus (Active Phase Transitions) Forms peaks where $\Delta V \to 0$ (valleys in $dV/dQ$) |
• Quantifying capacity width for individual phase transitions • Detecting active material loss ($\text{LAM}$) via peak area shrinkage • Intuitive peak tracking and integration |
| dV/dQ (DVA) Differential Voltage |
dV / dQ | Phase Boundaries & Voltage Steps Forms sharp peaks where voltage changes steeply with $\Delta Q$ |
• Pinpointing exact graphite staging inflection potentials • Accurate boundary determination at full charge and deep discharge • Direct stoichiometric slippage measurement (LLI) in milliampere-hours |
While $dQ/dV$ excels at quantifying phase transition capacity spans, $dV/dQ$ provides unmatched resolution for identifying transition boundaries and endpoints. Industrial diagnostics routinely combine both methods for comprehensive characterization.
③ In-Line Quality Screening on Cell Formation Lines
During cell manufacturing, initial formation cycling following electrolyte filling establishes the primary SEI film and determines ultimate cell quality. Monitoring low-rate $dQ/dV$ profiles during first charge enables automated, in-line detection of manufacturing variances:
- Coating Weight & Thickness Variations: Deviations in N/P ratio manifest as millivolt-level shifts in specific peak separations across the $3.0\sim 3.8\,\text{V}$ window.
- Micro-Shorts (Self-Discharge Leakage): Internal parasitic leakage currents depress the $dQ/dV$ baseline below $2.5\,\text{V}$ prior to initial SEI passivation.
- Electrolyte Additive Quality: Anomalous peak areas around the reduction potentials of additives such as VC or FEC ($2.8\sim 3.1\,\text{V vs Li/Li}^+$) identify sub-optimal filling or contamination.
④ Rapid Grading for Second-Life EV Battery Repurposing
As electric fleets mature, repurposing retired battery packs into stationary storage (BESS) is expanding rapidly.
However, conducting full charge-discharge cycles on thousands of decommissioned cells is commercially cost-prohibitive. Extracting $dQ/dV$ features from brief, partial cycling enables automated triage: distinguishing cells that experienced pure SEI-driven lithium inventory loss (LLI)—which remain safe and well-suited for stationary second-life reuse after pack re-matching—from cells suffering particle microcracking or active material loss ($\text{LAM}$), which should be routed directly to raw material recycling.
7. Conclusion: Unlocking the Full Potential of $dQ/dV$ through Physics Models
Differential Capacity Analysis ($dQ/dV$) is an extraordinarily powerful, non-destructive methodology for uncovering the internal phase equilibria and degradation breakdown (LLI, LAM, ORI) of lithium-ion cells without destructive teardown.
Yet, as explored throughout this article, experimental practice is filled with pitfalls: low ADC resolution, thermal chamber ripple, over-smoothing distortions, full-cell peak overlaps, and through-thickness reaction non-uniformities in porous electrodes. Accepting software output uncritically invites significant risk of confusing instrumentation noise or kinetic overpotentials with material degradation.
By grounding analysis in experimental physics and corroborating measured data against physics-based electrochemical models (SPMe / DFN), battery engineers can interpret $dQ/dV$ signatures with rigorous, objective confidence.
📚 References
- J. N. Reimers, J. R. Dahn (1992). “Electrochemical and In Situ X-Ray Diffraction Studies of Lithium Intercalation in $\text{Li}_x\text{CoO}_2$”. Journal of The Electrochemical Society, 139(8), 2091–2097. DOI: 10.1149/1.2221184
- I. Bloom, A. N. Jansen, D. P. Abraham, et al. (2005). “Differential voltage analyses of high-power, lithium-ion cells: 1. Technique and application”. Journal of Power Sources, 139(1-2), 295–303. DOI: 10.1016/j.jpowsour.2004.07.021
- M. Dubarry, B. Y. Liaw (2009). “Identify capacity fading mechanism in a commercial $\text{LiFePO}_4$ cell”. Journal of Power Sources, 194(1), 541–549. DOI: 10.1016/j.jpowsour.2009.05.036 (* Note: Early letter: Electrochem. Solid-State Lett., 9(10), A454–A457, 2006)
- M. Dubarry, C. Truchot, B. Y. Liaw (2012). “Synthesize battery degradation modes via a diagnostic and prognostic model”. Journal of Power Sources, 219, 204–216. DOI: 10.1016/j.jpowsour.2012.07.016
- C. R. Birkl, M. R. Roberts, E. McTurk, P. G. Bruce, D. A. Howey (2017). “Degradation diagnostics for lithium ion cells”. Journal of Power Sources, 341, 373–386. DOI: 10.1016/j.jpowsour.2016.12.011
- Y. F. Reynier, R. Yazami, B. Fultz (2004). “Thermodynamics of Lithium Intercalation into Graphites and Disordered Carbons”. Journal of The Electrochemical Society, 151(3), A422–A426. DOI: 10.1149/1.1646152 (* Preceding work: Journal of Power Sources, 119–121, 850–855, 2003, DOI: 10.1016/S0378-7753(03)00285-4)
- K. A. Severson, P. M. Attia, N. Jin, et al. (2019). “Data-driven prediction of battery cycle life before capacity degradation”. Nature Energy, 4(5), 383–391. DOI: 10.1038/s41560-019-0356-8
Bridging Physics Simulation and Experimental Testing
At ED&C (YK Energy Device & Consulting), we develop browser-based electrochemical simulators and provide engineering consulting for battery parameter identification, electrochemical impedance spectroscopy (DRT) analysis, and degradation mode (LLI / LAM) diagnostics.
Consulting & Technical Inquiries →